FORESTS 2018, QUESTIONS ONE: DUE Monday 7 October
These are open-ended questions. This will be the norm for this class. I won't generally ask explicitly for definitions or blank-filling and such -- BUT you should use the terminology and concepts we develop in class (and that are reviewed in the class notes), and your answers will be evaluated, in part, on how well you do that . Primarily, though, evaluation will be on the basis of a) how clearly and fully you address what's asked and b) how well you build your arguments.
Don't wander; suitable answers will almost always be possible in a paragraph or two of a few sentences and often less -- so it's important to thnk carefully about what, specifically, is being asked, and to keep your own answers sharply focused.
1. A
question for working with hypothesis generation and testing:
Review
notes on the ecology of Lyme disease from the
first class and reading. Researchers studying the Lyme disease epidemic have
offered several models (hypotheses) proposing ecological linkages in
a network of causes and effects that might regulate Lyme
disease -- either promoting or limiting its spread. They have compiled
data to assess or test some of these
hypotheses, but most have been only partially tested and some, while
plausible, remain essentially untested. Briefly (a paragraph or so -- no more!),
propose further
research focused on better understanding some part of this network of
interactions.
a) Identify and
state a research question
that's related to some part of this system, framing it as a hypothesis.
Connect it to info from readings or notes. It's important that it
be something that you could, in principle, test (this could be
something that's
directly suggested -- but not pursued -- in material
discussed/presented, or something that's not specifically mentioned,
but is suggested to you by that material).
b) Suggest
at
least one
testable prediction
(could be more than
one!) derived from
that hypothesis (“If this hypothesis is true, then we should
see....”). Make sure it's a prediction that's specific to that
hypothesis (i.e., are there other hypotheses that would produce the
same prediction?)
c) Suggest
a basic, plausible approach
to testing
that prediction;
this
could be pretty general and rough (“I would collect data of this sort
and see if I see the pattern predicted....”).
Refer to data-graphics or studies cited
in the class notes as
appropriate to support your research question and design. Be
concise; focus on the
essential
points.
Endless possibilities here, of course; the main things to focus on are: 1) refining your hypothesis so that it states a clearly defined cause-effect relationship you're suggesting/investigating -- including some 'mechanism' (i.e., not just "x should be related to y", or 'this happen if I did that', but incorporate some explanation as to why!), 2) and suggesting a prediction that is a necessary consequence of your hypothesis and that offers a lever for testing it rigorously. That last point is the trick; a goodprediction for this purpose is one that would be true if your hypothesis is correct but NOT if some alternative mechanism applied. In a number of cases, you offered predictions that were consistent with your hypothesized cause-effect model -- but could also result from other processes as well (this is a 'control' issue; think about how you can be confident that IF you get the results you expected/predicted, that they're due to the reasons you've hypothesized).. Then 3), when you suggest ways of testing this prediction, think in terms of critical comparisons (where results would be different) if hypoth true or not. Also, always try to think in terms of active manipulations/experiments (not just comparisons of 'natural' situations) that would make your approach more powerful. A lot of suggestions involved simply monitoring what happens and looking for correlations between things (like "more Lyme disease in years with more acorn production") but how can you be confident that the 'more Lyme' is because of the more acorns (maybe big mast years for oak follow wet summers, and it's actually weather that drives tick populations...). Yourapproach could be much strengthened by doing some active 'tweaking' (like adding acorns or removing acorns and seeing if hypothesis' predictions still happen...). HERE, the IMPORTANT thing is to focus on how to go from an observation or question to a USABLE HYPOTHESIS and then to think rigorously and concisely about how to address/test it.
2. Thinking about
island biogeography and diversity: Recall the general
relationships between colonization rate, extinction rate, island
distance from a source of migrants (= isolation), and island size in
shaping the "equilibrium diversity" of an island under
the MacArthur-Wilson model (refer to online
notes for summary; remind yourself particularly of the graphical
version of the model).
As we briefly discussed, other types of habitats occurring in isolated
patches, surrounded by very different habitats might be island-like
enough to be described by the same model. Fresh-water ponds,
for
example, amount to ‘islands’ of distinct habitat isolated, to some
extent, in a terrestrial
landscape. Thus, it might make sense to hypothesize that the MacArthur-Wilson
equilibrium model would predict differences in diversity among ponds ponds for aquatic organisms. The size effect (mostly on extinction rate) seems like it would apply pretty straightforwardly. However, translation of
the ‘distance (isolation) effect’ on colonization rate may require careful thought.
How
might
you restate that
part of the model to make it applicable for bodies of fresh water?
Are there differences in the way you need to think about
'isolation'? What
factors might
influence colonization
rates of aquatic organisms, and how might you express them in colonization curves
as in
the original M-W
model? (In
other words, what pond properties do you think might be most important
in determining their isolation and the frequency of colonization?) Ponds host organisms of many types
(algae, birds, fish,
plants, many groups of insects, frogs..); some spend their entire
life-cycle in the water (e.g., fish, many small invertebrates, algae),
while others may be only partially aquatic (like pond turtles), or be
able to move between ponds at some point in their life-cycle (like
frogs, dragonflies, that are strictly aquatic as larvae, but can
disperse as adults). How
might
your thinking about factors
constraining or promoting the 'colonization curve' affect these groups
differently
(choose two or three to contrast)? How might this affect your
predictions about diversity patterns for those groups (i.e., how would
diversity patterns relate differently to degree of isolation)?
Main
thing here is to recognize that, while 'colonization rate' in the M-W
model is approached as primarily related to distance from mainland
(or, more generally, any source of new colonists), that's really just a
way of representing
degree of isolation; more remote islands have lower colonization
rates, thus lower equilibrium diversity. If you're looking at
other isolated habitat patches as 'island-like' the question becomes,
'can I describe
degree of isolation in terms of some other variables?'. If you
can, then, in
principle, the same model structure can be used -- you just 'code'
isolation differently. Oceanic islands and ponds are both types
of habitats isolated in a background of very different habitat;
applying the colonization model to ponds, however, offers a couple of
challenges: there's usually no simple 'mainland' equivalent for
freshwater bodies (unless you happen to be near a very large lake or
something). That's one thing you could talk about. Also,
the ways in which aquatic creatures can
disperse across land vary a lot, and some simply can't. The first
problem might be addressed by coming up with some measure of proximity
of any larger body of water (or number of nearby ponds). The
second problem may be trickier but more interesting. For groups
that have parts of
life-cycle where they can fly (like dragonflies) or are fully
terrestrial (like toads), ponds may be, in effect, not particularly
isolated at all -- not islands in the M-W sense -- and so diversity
might be little affected by distance from other aquatic habitat, and the M-W model wouldn't really apply!
However, for organisms that require on aquatic (or very wet)
habitat during all of their life-cycle (fish, some amphibians, algae,
...),
isolation should certainly affect colonization rates and so diversity.
But simple distance between ponds might not be the best measure
of isolation; two nearby ponds with a big, dry ridge between
might be more isolated than two that are much further apart, but
connected by a stream or wetlands. You might come up with some measure
of 'connectedness' as functionally equivalent to 'remoteness' of an
island from mainland -- are there wetlands or streams that connect the
'target' pond to
others? How long/large are they? How persistent/reliable? Some
of you
considered treating movement between ponds by fishermen, boats,
even birds or moose as possible mechanisms of dispersal for organisms
that can't fly or walk across land themselves; this is certainly
plausible and one of you suggested using frequency of boat
launchings as
another index of isolation, comparable to distance in the standard M-W
model... (but
note: this question asks about a) the applicabiity of the M-W model and
b) specifically of the colonization-as-function-of -isolation part of
the model. It's not about extinction rate or island/pond size or
other things not related to these two points. Some of you talked
a lot about other stuff, and what you said might have been reasonable
-- but not really pertinent to building a good answer to this question!)
3. Infectious disease -- the effects of pathogens and parasites -- can be a significant cause of mortality in almost all species (malaria, for example, has probably caused more human deaths than any other single factor). Would you expect disease to function generally as a density-dependent or a density-independent factor in its effects on population growth? Make sure you understand this distinction (refer to class notes as necessary). Explain your answer in terms of the underlying premises distinguishing these concepts (i.e., does the size or density of the population affect basic population-regulation processes?) How might you test your expectation (hypothesis) for a particular case? Think in terms of predictions and possible experiments... (For example, a few years ago, a rabies epidemic -- a disease that is extremely virulent/lethal -- caused local racoon populations to decline substantially; what information might allow you to assess whether the effects of rabies were, in this case, density-dependent? Or you can use some other disease scenario...).
The key point: A thing/phenomenon has density-dependent effect on population growth of some population IF the intensity of its effect (on birth or death rates) changes with the density of the target population. That is, birth or death rate (or, equivalently, the chance of an individual dying or giving birth) must change with the density of the population, in this case of the 'host' species. Most infectious diseases will be density-dependent. A couple of reasons why this is so, both raised by some of you (stated as hypotheses): 1) likelihood of pathogen infecting new hosts is higher in dense populations since host individuals will come in contact with other individuals more often, increasing likelihood of catching the disease (and so increasing chance that any individual will die from the disease); 2) in dense populations (near carrying capacity), individuals might be more stressed by food limitations, making them more vulnerable to infection and more likely to die from it. NOTE that the first hypothesis requires that the probability of disease transfer be enhanced by greater proximity of hosts; the second doesn't, necessarily. Some of you suggested that it might matter how disease is transmitted; that's correct. Not all diseases are transmitted directly from host to host (think Lyme disease or malaria, which are 'vectored'), OR they are so efficient at communication between hosts that they spread even in sparse populations. These might be less density-dependent under reason of first hypothesis (mosquito can find you even if you're not right next to someone with malaria), but the second might still make them behave in density-dependent manner, at least at high population densities. (Human rabies is always caught from some other animal, so not directly influenced by human population density at all!)
TO TEST whether a particular disease's influence is density-dependent, you simply have to construct a scenario where you can compare death rates (proportion dying per time unit) due to the disease between populations of different density. But this must invoke appropriate controls; populations must be otherwise similar, there can't be differences in other potential causes of death. If you're testing first hypothesis above, you have to make sure that neither population is food-limited (which could confound issues by bringing second mechanism into effect). The best controls would be populations of similar densities (and otherwise the same) but without the disease. (e.g., four populations; 2 dense and one with disease, 2 not dense and one with disease). You could do this experimentally by introducing disease to appropriately different or similar populations. In the raccoon example, where it's not a controlled experiment, you'd need data from areas of different raccoon density; if a larger proportion are dying in the denser population, it MIGHT be dens-dep. (As one of you noted, it might matter whether the rabies pathogen is generally transmitted directly from one raccoon to another. It is...) AS ALWAYS, it is necessary that you be clear about what results must look like if your hypothesis is correct...
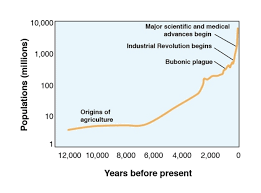
4.
The figure below describes an approximate trajectory of global human
population growth since the origins of agriculture about 11,000 years
ago. Note that the verticle axis is scaled exponentially. a) During what periods do we observe what looks like exponential growth with a constant value of "r" (intrinsic rate of increase)? b) How and when does it appear that r changes? c) What
are possible reasons for changes in r (consider the essential
demographic components of 'r'; think in terms of factors that might
limit population growth)? d) Can you use the information on this graph to infer anything about a global human carrying capacity? Explain...