
FORESTS 2017: QUESTIONS TWO: DUE Monday October 15
(Review posted notes for population regulation section as
needed to make sure concepts and background for these questions are
clear.)
The key point: IF a phenomenon has density-dependent effect on population growth, that means the intensity of that effect will change with the density of the population. That is, birth or death rate (or, equivalently, the chance of an individual dying or giving birth) must change with the density of the population. Most infectious diseases will be density-dependent. A couple of reasons why this is so, both raised by some of you (stated as hypotheses): 1) likelihood of pathogen infecting new hosts is higher in dense populations since host individuals will come in contact with other individuals more often, increasing likelihood of catching the disease (and so increasing chance that any individual will die from the disease); 2) in dense populations (near carrying capacity), individuals might be more stressed by food limitations, making them more vulnerable to infection and more likely to die from it. NOTE that the first hypothesis requires that the probability of disease transfer be enhanced by greater proximity of hosts; the second doesn't, necessarily. Some of you suggested that it might matter how disease is transmitted; that's correct. Not all diseases are transmitted directly from host to host (think Lyme disease or malaria, which are 'vectored'), OR they are so efficient at communication between hosts that they spread even in sparse populations. These might be less density-dependent under reason of first hypothesis (mosquito can find you even if you're not right next to someone with malaria), but the second might still make them behave in density-dependent manner, at least at high population densities. (Human rabies is always caught from some other animal, so not directly influenced by human population density at all!)
TO TEST whether a particular disease's influence is density-dependent, you simply have to construct a scenario where you can compare death rates (proportion dying per time unit) due to the disease between populations of different density. But this must invoke appropriate controls; populations must be otherwise similar, there can't be differences in other potential causes of death. If you're testing first hypothesis above, you have to make sure that neither population is food-limited (which could confound issues by bringing second mechanism into effect). The best controls would be populations of similar densities (and otherwise the same) but without the disease. (e.g., four populations; 2 dense and one with disease, 2 not dense and one with disease). You could do this experimentally by introducing disease to appropriately different or similar populations. In the raccoon example, where it's not a controlled experiment, you'd need data from areas of different raccoon density; if a larger proportion are dying in the denser population, it MIGHT be dens-dep. (As one of you noted, it might matter whether the rabies pathogen is generally transmitted directly from one raccoon to another. It is...) AS ALWAYS, it is necessary that you be clear about what results must look like if your hypothesis is correct...
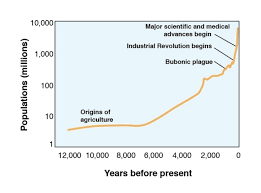
2. The
figure below describes an approximate trajectory of global human
population growth since the origins of agriculture about 11,000 years
ago. Note that
the
verticle axis is scaled exponentially. a) During what
periods do we
observe what looks like exponential growth with a constant value of "r"
(intrinsic rate of increase)? b) How and when
does it appear that r changes?
c) What
are possible reasons for changes in r (consider the
essential demographic components of 'r'; think in terms of factors that
might limit population growth)? d) Can you use the information on
this graph to infer anything about the global human carrying capacity?
Explain...
This pattern might be the result of competitive interactions involving niche partitioning -- that is, some displacement of each species from parts of its fundamental niche (here, 'food niche' only) when the two are in sympatry. When they're not in same habitat (allopatry), the two species exhibit similar patterns of food use, though with some slight proportional differences in types of food consumed or preferences. The patterns in top graph (assuming no other competitors present) amount to an expression of fundamental niche as far as food goes. In sympatry, competition seems to drive a change in consumption by CHAR by quite a bit; they shift almost entirely to small crustaceans (not preferred much by either species in allopatry), while trout become pretty specialized on insect larvae (a more modest shift in preference, but a significant narrowing of diet). In both cases realized niche appears to be reduced from fundamental niche -- both species are affected by competition -- but the shifts are asymmetrical in that char, in sympatry, are largely restricted to a food group that isn't favored by either when they're in allopatry; in other words, you might interpret this evidence to suggest that char are a weaker competitor. All of this should be regarded as HYPOTHESIS, as there are other things that might be going on. Since these are natural streams, we don't know. for example, whether a) there are other species of competing fish in some streams or b) the abundance of these different food groups varies among the streams regardless of which fish are there (for example, observed patterns could simply be result of differences in prey availability among streams!). Possible experiments/tests (among many) might look at these assumptions/constraints. You could add food to streams with competitors (expectation, IF this is about competition, would be at least short-term 'return' to favored food groups, at least until fish populations grew). You could add char or trout to streams where the other was previously in allopatry and see if both shift to food-use patterns like bottom graph (as would be predicted by the hypothesis outlined). You could remove one species or the other or both from some stretches of stream (like some experiments in the competition notes). You could add or remove specific groups of prey types and see if patterns change as predicted. Some of you suggested that the INTERspecific competition might be expressed by more restricted foraging (to different portions of stream) by one or both species; that could be examined by appropriate experiments or observations (but describe them in at least a basic way). You could do some similar experiments in controlled environments in lab or in experimental streams set up for the purpose and similar in all other ways. You might predict that in the sympatric situations, all else equal, both species should have lower-density populations if the sympatric pattern is, in fact, due to competition. And so on. In all cases, you should consider expected results if your hypothesis is correct or not...