FORESTS 2017: QUESTIONS TWO: DUE Monday October 15
(Review posted notes for population regulation section as
needed to make sure concepts and background for these questions are
clear.)
1.
Infectious disease -- the effects of pathogens and parasites -- can be
a significant cause of mortality in almost all species (malaria, for
example, has probably caused more human deaths than any other single
factor). Would
you expect disease to function generally as a density-dependent or a
density-independent factor in its effects on population growth?
Explain your answer in terms of the underlying premises distinguishing
these concepts (i.e., does the size or density of the
population
affect basic population-regulation processes?) How might you
test your expectation (hypothesis) for a particular case?
Think in terms of predictions and possible experiments... (For example,
a few years ago, a rabies epidemic caused local racoon
populations to decline substantially; what information might allow you
to assess whether the effects of rabies were, in this case,
density-dependent?)
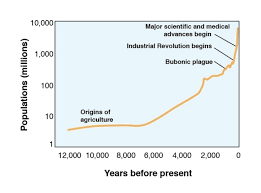
2. The
figure below describes an approximate trajectory of global human
population growth since the origins of agriculture about 11,000 years
ago. Note that
the
verticle axis is scaled exponentially. a) During what
periods do we
observe what looks like exponential growth with a constant value of "r"
(intrinsic rate of increase)? b) How and when
does it appear that r changes?
c) What
are possible reasons for changes in r (consider the
essential demographic components of 'r'; think in terms of factors that
might limit population growth)? d) Can you use the information on
this graph to infer anything about the global human carrying capacity?
Explain...
1.
These graphs show how two related species of fish -- brown trout
(open bars) and arctic char (filled bars) use different types of prey
(as percentages of their total diet) when they are living in same
streams (sympatric, bottom) or in separate streams (allopatric,
top). The prey types are: A = small fish, B = small
crustaceans, C = large crustaceans, D = insect larvae, E =
terrestrial insects, F = everything else. Interpret these data
to generate
hypotheses about the the fundamental and realized niches of
these species as
they are related to food, and about the
competitive relationships between them.
These data are collected from stomach contents of wild fish in
unmanipulated streams. Propose
an additional experiment to test some aspect of the hypotheses you
come up with.

